


Introduction:
In modern electronics, passing compliance tests is not an afterthought – it must be designed in from the very beginning. This blog takes you through the journey of designing a motor driver PCB, starting from schematic capture in CST Studio Suite, to performing IR drop and conducted emission (CE) testing using CST Studio Suite. By simulating EMI/EMC effects early in the design flow, engineers can avoid costly redesigns and increase the chances of first-pass success at the compliance lab.
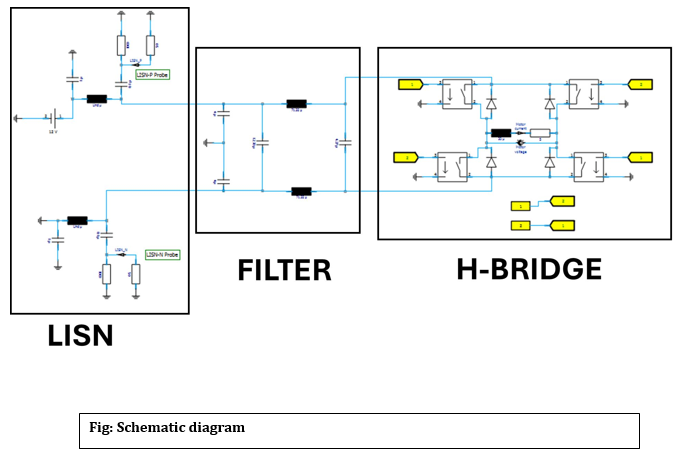
1. Schematic-Level CE in CST Circuit & System:
Goal: Build the H-Bridge + EMI filter as a circuit in CST (no PCB yet), excite it with PWM, and measure conducted emissions at the LISN port per CISPR 25 (V-method).
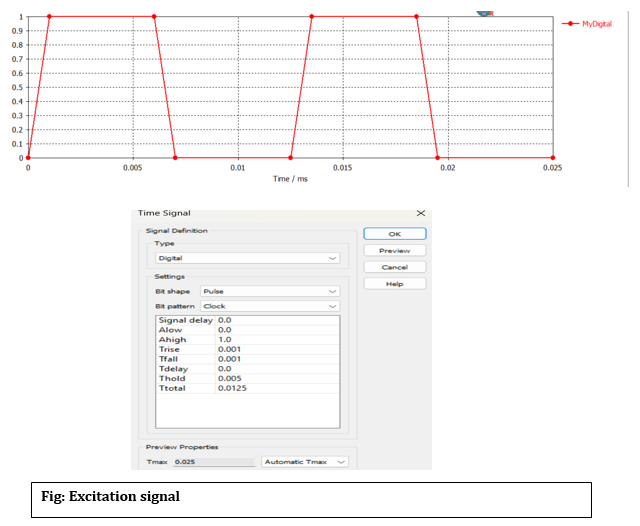
2. Excitations (PWM & supply)
The PWM gate signals were generated using Digital → Pulse (Clock pattern) with logic levels 0/1. A rise/fall of 0.001 ms and ON-time of 0.005 ms within a 0.0125 ms period gives an 80 kHz PWM at ~40% duty cycle (≈ 5 µs high, 7.5 µs low). These signals drive the H-bridge Voltage-Controlled Switches, while the motor is modelled by a simple R–L equivalent.
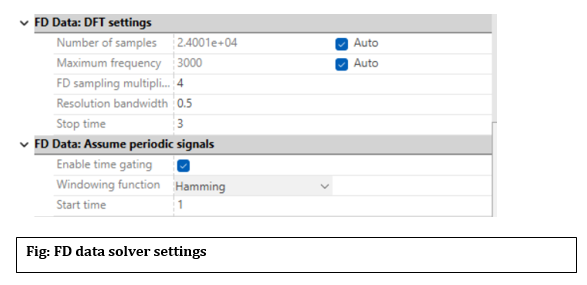
For reliable spectra, the transient simulation runs for 50–100 PWM cycles (≈ 0.6–1.2 ms). Frequency-domain analysis (up to 3 MHz) uses a 0.5 kHz RBW, Hamming window, and time gating from 1–3 ms to remove startup transients.
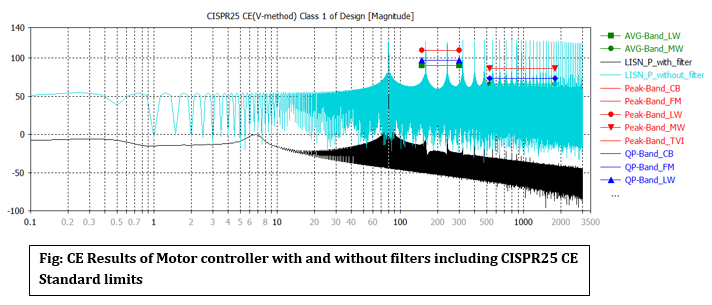
3. CE Results and Observations
Final takeaway: Filter is essential for passing CISPR25 in motor driver circuits.
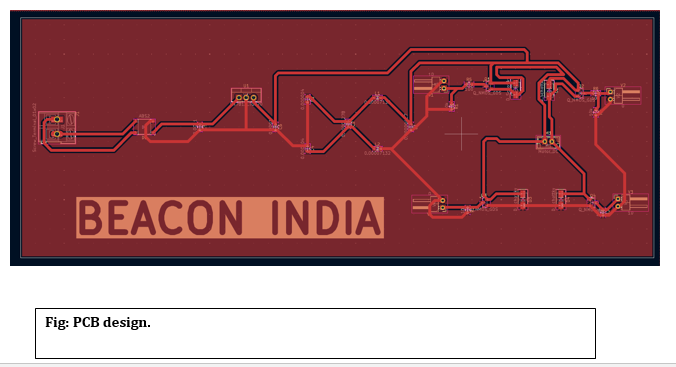
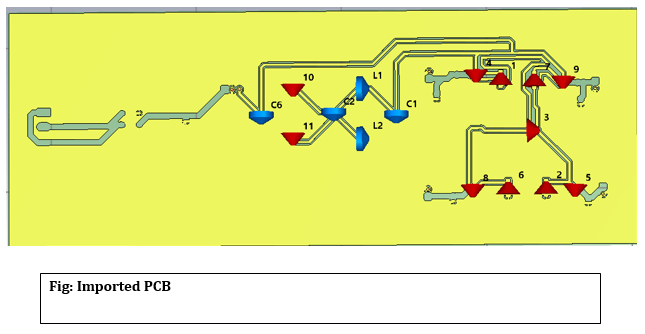
4. PCB Design & Import into CST
The designed schematic was captured in CST Circuit & System environment and later converted into a PCB layout using KiCad. The PCB was routed with proper net connections and exported in ODB++ format for CST import. This ensured that all nets, components, and layer stackup were preserved during transfer.
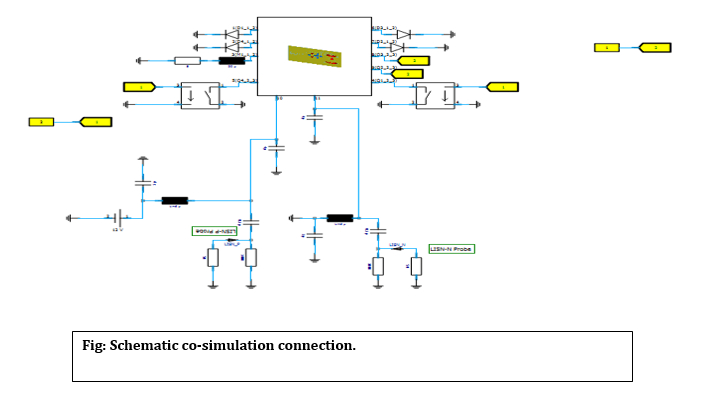
5. Simulation Setup in CST
Inside CST, the imported PCB was connected according to the schematic. Excitations, loads, and measurement ports were assigned to replicate the circuit-level configuration. Special attention was given to ground return paths and supply rails to accurately reflect the conducted emission behavior.
6. Simulation Results: Circuit vs PCB
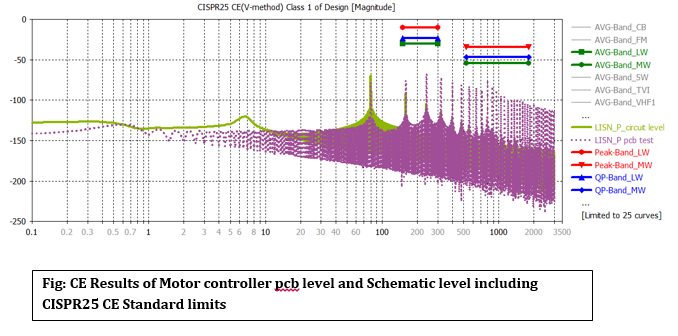
Fig: Emission Results of Motor controller at 150KHZ.
Fig: Emission Results of Motor controller at 2500KHZ.
Conclusion:
This study demonstrates a complete conducted emissions (CE) analysis workflow for an H-Bridge motor driver using CST Studio Suite. Starting from circuit-level modelling in CST Circuit & System, the design was progressively validated through LISN integration, EMI filtering, and transient analysis.
The schematic-only simulations provided an initial view of conducted noise generated by PWM switching. However, when the design was transferred into a PCB layout and simulated with parasitic effects included, the results showed noticeable differences. This highlights the importance of performing both circuit and PCB-level validation to obtain realistic EMI behaviour.
The LISN-based CE(V-method) measurements confirmed the impact of layout and filtering on emission levels. The filter stage played a crucial role in suppressing harmonic peaks and stabilizing the spectrum across the CISPR25-defined frequency bands. The comparison between schematic and PCB results underlines that early circuit simulations are valuable for rapid iterations, but PCB-level verification is essential for compliance assurance.
Overall, the workflow proves that CST Studio Suite enables a seamless transition from schematic design to full PCB validation, ensuring that emission performance can be predicted and optimized before hardware fabrication. This simulation-driven approach reduces prototyping costs, accelerates design cycles, and provides confidence in achieving regulatory compliance for automotive and industrial motor control applications.
We Urge You To Call Us For Any Doubts & Clarifications That You May Have. We Are Eager to Talk To You
Call Us: +91 7406663589
 (No Ratings Yet)
#365/8, Ground Floor, "Hasmitha Avenue", 16th Main, 4th T Block East, Jayanagar, 4th T Block East, Pattabhirama Nagar, Jayanagar, Bengaluru, Karnataka 560041
Rated 4.7/5 with a total of 62 reviews
"CARAX" Building 4th Floor, 105/1/1/4, Next to Radha Hotel, Pune-Mumbai Xpress Way,Baner,Pune 411045
Rated 4.7/5 with a total of 17 reviews
801, 8th Floor, LODHA Supremus, I-Think Techno Campus,Kanjurmarg EAST - MUMBAI, MH, India – 400042.
Rated 5/5 with a total of 51 reviews
501, 5th Floor, Connekt Coworking Space, Gala Argos, Netaji Rd, Ellisbridge, Ahmedabad, Gujarat 380006
Rated 4.1/5 with a total of 7 reviews
Best Engineering Aids & Consultancies Pvt. Ltd. No 306, Karunaa Conclave, 3rd Floor, AD Block, Shanthi Colony, Anna Nagar, Chennai - 600040
Rated 4.6/5 with a total of 16 reviews
Flat no F1, first floor, Nakhate corner, Eknath rang mandir road,New Usmanpura, Aurangabad, 431005.
A-101, 1st Floor, The Hub Complex, opp. Shete Hospital, Mahatma Nagar, Parijat Nagar, Nashik, Maharashtra 422005.
Best Engineering Aids & Consultancies Pvt Ltd (BEACON) Wellwork Workspaces, L1 - 1017A,B, Lower Ground Floor,Vasavi MPM Grand, Ameerpet, Hyderabad, Telangana 500073