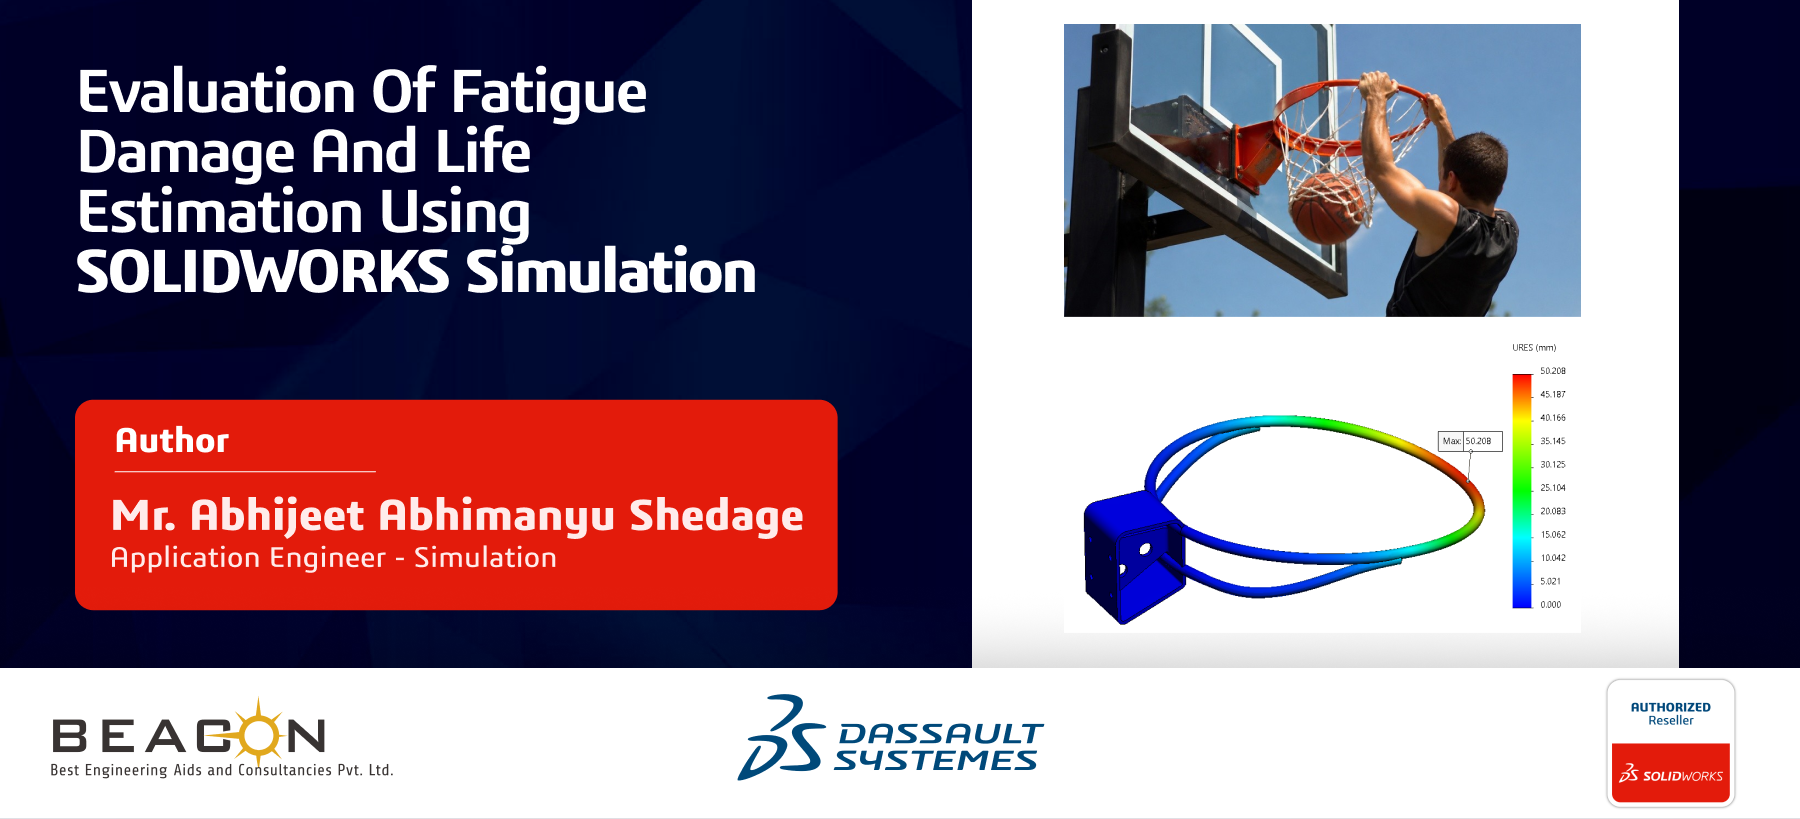


Durability, often assessed through fatigue analysis, is the ability of a component to withstand repeated loading over time. In real engineering applications, failures rarely occur due to a single overload; instead, they result from cyclic stresses that accumulate damage progressively.
Repeated loading and unloading can weaken components even when the induced stresses are well below allowable limits. This phenomenon, known as fatigue, is one of the most common causes of mechanical failure.
Each stress cycle contributes a small amount of damage. While individual cycles may appear insignificant, their cumulative effect leads to material degradation. After a sufficient number of cycles, the component becomes critically weakened and ultimately fails.
Fatigue is a primary failure mechanism in many engineering systems, particularly in metallic components. Typical examples include:
Rotating machinery
Bolts and fasteners
Aircraft wings
Automotive axles
Bridges and offshore structures
Consumer products
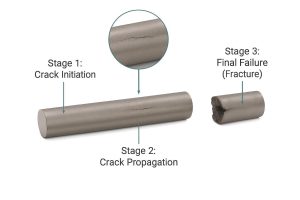
Fatigue failure develops progressively under cyclic loading. It is typically described in three stages, each with distinct physical behaviour and design implications.
The first stage begins with the formation of small cracks, typically in areas exposed to repeated stress, surface imperfections or geometric stress concentrations.
With continued cyclic loading, the initiated crack gradually grows. The rate of crack propagation depends on factors such as stress levels, material properties and loading conditions.
Once the crack reaches a critical size, the remaining cross-section of the component can no longer withstand the applied load, resulting in final fracture.
Before performing fatigue analysis, a linear static simulation is first carried out. It uses stress results obtained from a reference structural study.
For this study, we are simulating a situation where:
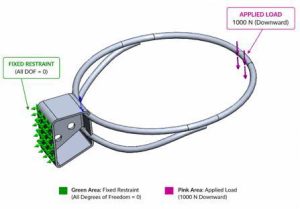
The backboard side is fully constrained.
The rim is pulled downward at a specific location.
This setup helps us understand how the structure behaves under realistic conditions, including how it bends, where stress develops and which areas are critical.
The biggest advantage of SOLIDWORKS Simulation is that design and simulation work together in a single environment. Design changes can be reflected in the analysis, making it easier to evaluate and refine the model throughout the development process.

While the static study shows how the rim behaves under a single high load, real-world usage involves repeated loading during gameplay. Every shot, dunk and impact applies cyclic stresses to the structure. To evaluate long-term durability, a fatigue analysis is performed based on the stresses obtained from the static study.
The objective of this study is to estimate the life of the rim under repeated loading conditions and identify regions prone to fatigue failure.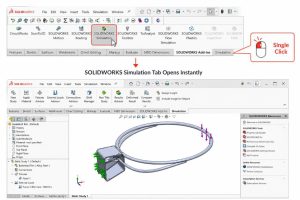
The basketball rim is fixed at the mounting plate, representing its attachment to the backboard. A downward load of 1000 N is applied on the rim to simulate real-world conditions such as a player performing a slam dunk.
The stress and displacement results obtained from the analysis are presented below:
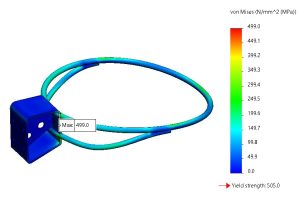
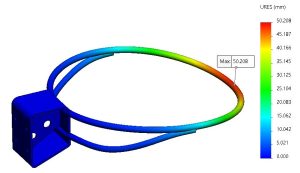
While the static nonlinear study shows how the rim behaves under a single high load, real-world usage involves repeated loading during gameplay. Every shot, dunk and impact applies cyclic stresses to the structure. To evaluate long-term durability a fatigue analysis is performed based on the stresses obtained from the static study.
Fatigue analysis:
The objective of this study is to estimate the life of the rim under repeated loading conditions and identify regions prone to fatigue failure.
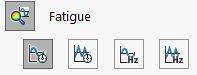
SOLIDWORKS Simulation supports different types of fatigue studies for evaluating component durability under different loading conditions:
Constant amplitude event study
Variable amplitude event study
Harmonic fatigue of sinusoidal loading
Random vibration fatigue
The appropriate study type depends on the nature of the loading experienced by the component.
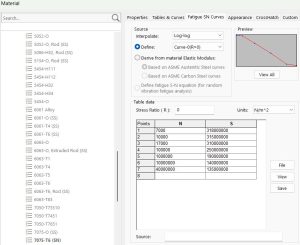
To run a fatigue study, an S-N curve must be assigned to the material used in the model. This curve defines the relationship between alternating stress and the number of cycles a material can withstand before fatigue failure.
The curve can be created by entering alternating stress versus number-of-cycles data or by selecting an existing S-N curve from the material database.
For this study, the appropriate S-N curve is selected from the material database and applied to the model.
After material properties the most important step is to add loading events:
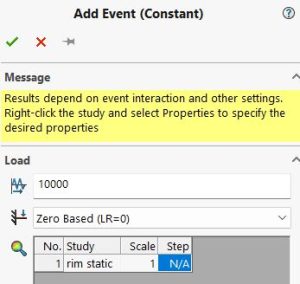
The below figure shows the definition of a constant amplitude fatigue event in SOLIDWORKS Simulation. The fatigue life is evaluated over 10,000 load cycles, using a zero‑based load ratio (R = 0) where the load varies from zero to the maximum value obtained from the associated rim static study.
Result Interpretation:
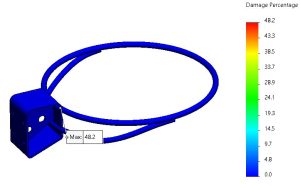
Above plot shows the fatigue damage percentage in the component after cyclic loading. The colour scale represents how much of the fatigue life is consumed at each location.
The highlighted region shows a maximum damage of 48.2%, meaning nearly half of the fatigue life is already used under the defined loading conditions. Blue areas indicate minimal damage, while warmer colours pinpoint fatigue‑critical zones caused by higher stress concentrations.
the part is safe for now but this region is the first to fail if loading continues.
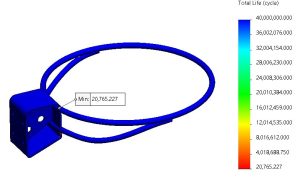
Above plot shows the predicted fatigue life in cycles obtained from SOLIDWORKS fatigue analysis. The minimum life of approximately 20766 cycles identifies the most critical location, which governs the overall durability of the component.
The fatigue damage plot shows the percentage of fatigue life consumed by the component after cyclic loading. The colour scale represents how much of the fatigue life has been used at each location.
The highlighted region shows a maximum damage of 48.2%, meaning nearly half of the fatigue life has already been consumed under the defined loading conditions. Blue areas indicate minimal damage, while warmer colours identify fatigue-critical zones caused by higher stress concentrations.
The part is safe under the defined conditions for now, but the highlighted region represents the location most likely to experience fatigue failure first if the loading continues.
The predicted fatigue life shows the number of cycles the component can withstand under the defined loading conditions. SOLIDWORKS Simulation Software predicts a minimum life of approximately 20,766 cycles at the most critical location.
This minimum-life region governs the overall durability of the component and provides engineers with a clear indication of where fatigue performance may need to be improved.
The fatigue study builds on the results obtained from the structural analysis. SOLIDWORKS FEA Analysis helps engineers understand stress distribution and identify critical regions before using those results for fatigue-life estimation.
By combining finite element analysis with material fatigue data and realistic loading conditions, engineers can evaluate both the immediate structural response of a component and its expected performance under repeated loading.
Fatigue analysis goes beyond checking whether a part is strong enough; it answers the more important question of how long the part will last under real operating conditions. By combining linear static results, material S-N curves and realistic loading events, engineers can predict fatigue life, identify critical regions and reduce the risk of unexpected failure.
SOLIDWORKS Simulation Software bridges the gap between structural analysis and real-world durability by converting stress results into meaningful fatigue-life information. This helps engineers make informed design decisions and develop safer, more reliable and longer-lasting components.
Created By: Abhijeet Abhimanyu Shedage
Best Engineering Aids & Consultancies Pvt. Ltd.
We Urge You To Call Us For Any Doubts & Clarifications That You May Have. We Are Eager to Talk To You
Call Us: +91 7406663589
Brigade Deccan Heights, 42, 14th Floor, 5th Mile, Tumkur Rd, Yeshwanthpur Industrial Area, Phase 1, Yeswanthpur, Bengaluru, Karnataka 560022
Rated 4.7/5 with a total of 62 reviews
#1120, 11th Floor, Solitaire business Hub - Baner, Balewadi High Street, Baner, Pune-411045
Rated 4.7/5 with a total of 17 reviews
801, 8th Floor, LODHA Supremus, I-Think Techno Campus,Kanjurmarg EAST - MUMBAI, MH, India – 400042.
Rated 5/5 with a total of 51 reviews
501, 5th Floor, Connekt Coworking Space, Gala Argos, Netaji Rd, Ellisbridge, Ahmedabad, Gujarat 380006
Rated 4.1/5 with a total of 7 reviews
Best Engineering Aids & Consultancies Ltd. No 306, Karunaa Conclave, 3rd Floor, AD Block, Shanthi Colony, Anna Nagar, Chennai - 600040
Rated 4.6/5 with a total of 16 reviews
A-101, 1st Floor, The Hub Complex, opp. Shete Hospital, Mahatma Nagar, Parijat Nagar, Nashik, Maharashtra 422005.
Best Engineering Aids & Consultancies Ltd (BEACON) Wellwork Workspaces, L1 - 1017A,B, Lower Ground Floor,Vasavi MPM Grand, Ameerpet, Hyderabad, Telangana 500073
2nd floor, Mokha Tower, Plot No.169, Mankapur Ring Rd, Trimurti Nagar, Nagpur, Maharashtra 440022


 Location