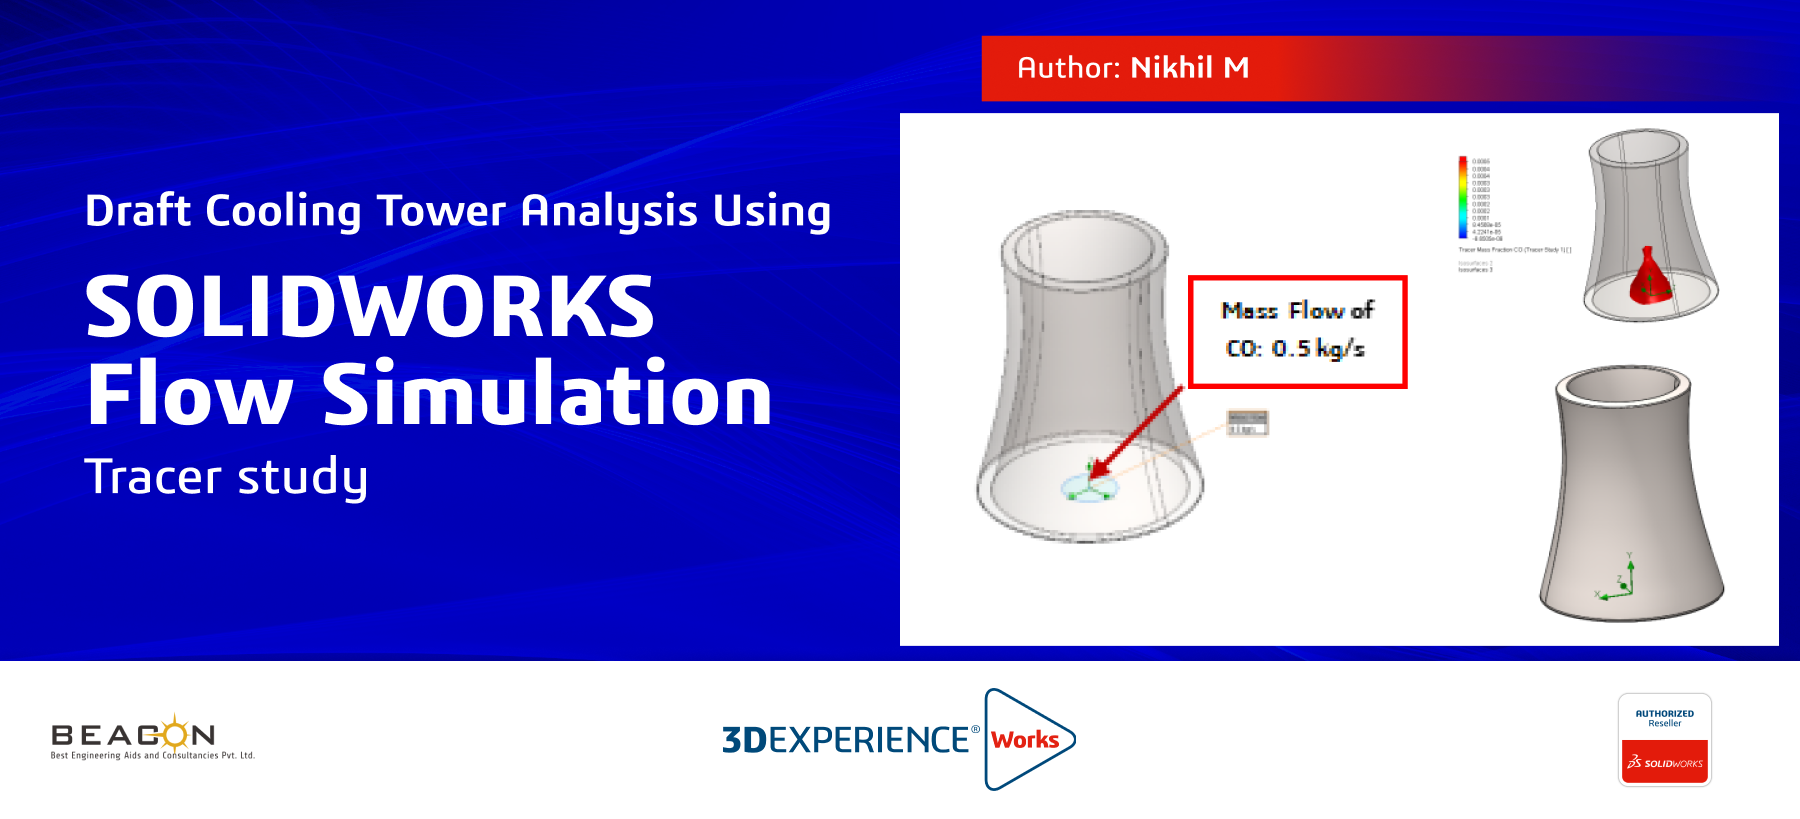


Cooling towers are vital for industrial processes, requiring efficient operation for safety and compliance. This study uses the HVAC module in Solidworks flow simulation to trace how CO disperses in the airflow.
Here we consider CO which acts as a tracer gas in this example referring to the work by Guo et al [1], helping visualize airflow-driven behavior inside a draft cooling tower.
solidworks simulation accurately models complex flow patterns affected by buoyancy and gravity. The HVAC module enables detailed analysis of tracer dispersion in realistic operating conditions. This helps assess ventilation performance and improve environmental control strategies.
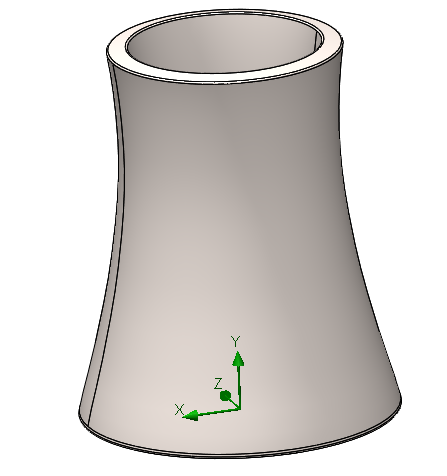
To evaluate the dispersion behaviour of carbon monoxide (CO) released as a tracer gas.
To visualize CO distribution using iso surface plots of mass fraction.
To understand CO dispersion characteristics in airflow using the tracer study method.
The HVAC module includes tools to simulate airflow and pollutant dispersion in HVAC and ventilation systems. A tracer study involves injecting CO as a passive gas tracer to track its concentration and movement in the airflow, helping engineers visualize pollutant spread and identify critical zones within ventilation structures.
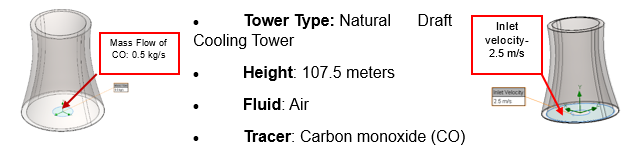
Inlet air enters at the bottom in cooling tower at a velocity of 2.5 m/s and formula-driven wind velocity in the Z direction. Due to the buoyancy-driven natural draft considered, air velocity is generally considered in cooling tower is 2.5 m/s.
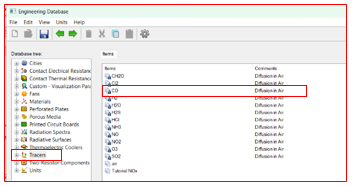
CO is injected at the base as a tracer gas with a mass flow rate of 0.5 kg/s, using the predefined tracer option available in the HVAC module’s Engineering Database in SOLIDWORKS Flow Simulation.
Ambient conditions are set to 1 atm pressure and 25°C temperature.
It is common in engineering practice to describe the wind profile with a power-law in non-complex terrain up to a height of about 10 m above ground level. The velocity has been defined in a Z direction with a variable wind speed based on the height of the structure.
V(h) is the wind speed at height h.
Vr is the known wind speed at a reference height hr.
Here the power-law exponent p is considered as 0.25 for noncomplex terrain, which is an empirically derived coefficient that varies dependent upon the stability of the atmosphere from about 0.1 to about 0.6.
The larger the power-law exponent, the larger the vertical gradient in the wind speed.
Gravity is enabled to simulate buoyancy-driven natural draft flow within the tower.
Results:
The velocity contour plot helps visualize the airflow distribution within the cooling tower and understand how airflow patterns influence the movement and dilution of the tracer gas.
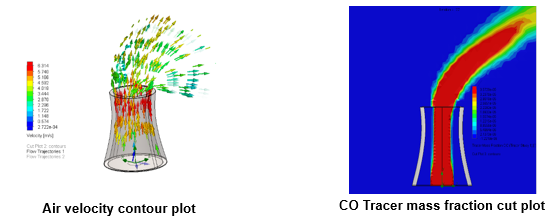
These Iso Plots (Iso surfaces) visualize various mass fractions of CO. They demonstrate the dispersion of the CO tracer in the cooling tower as it moves through the tower.
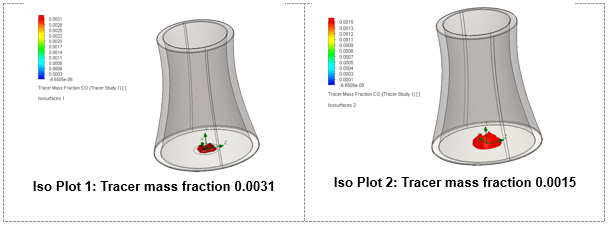 Plot 1 shows highest concentration zones near the CO injection at the tower base.
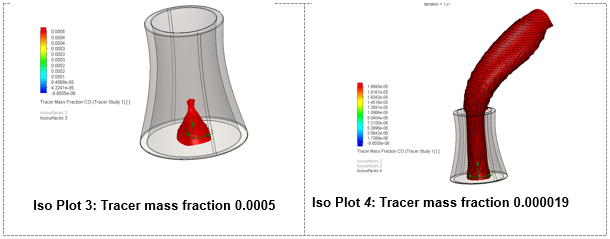
Plot 4 shows the Air velocity distribution influence which governs the transport and dilution of CO tracer gas.
These Iso plots (Iso Surfaces) show concentration thresholds and reveal how far and wide CO spreads inside the tower structure.
Tracer Gas Definition: A CO tracer gas, at is injected at the base of the tower. This utilizes a predefined tracer option found in the HVAC module’s Engineering Database within SOLIDWORKS Flow Simulation.
The SOLIDWORKS Flow Simulation HVAC module provides visualization features such as cut plots and Iso plots (Iso surface) contours for detailed analysis of CO dispersion to interpret the results.
Using HVAC module’s tracer study capabilities for identifying zones with potential hazardous CO buildup inside structure for safety assessments in industrial environments.
SOLIDWORKS FEA Analysis can also be considered as part of broader engineering simulation workflows where structural behaviour needs to be evaluated alongside flow and environmental conditions.
The results from solidworks simulation can provide engineers with useful insights when assessing systems that involve multiple engineering parameters and operating conditions.
SOLIDWORKS FEA Analysis can complement flow-based studies by helping engineers evaluate structural considerations in engineering systems where airflow, pressure, thermal effects and structural performance may need to be assessed together.
Using the Tracer study in SOLIDWORKS Flow Simulation HVAC module to conduct tracer studies provides engineers with a powerful and accessible way to analyse CO dispersion in draft cooling towers. By leveraging tracer gas features combined with gravity effects, it delivers valuable insights into pollutant transport and ventilation design optimization.
This approach demonstrates how solidworks simulation can be used to understand airflow behaviour and tracer dispersion within complex industrial structures.
Reference
Guo, Dong-Peng, et al. “Wind Tunnel Experiment for Predicting a Visible Plume Region from a Nuclear Power Plant Cooling Tower.” Journal of Applied Meteorology and Climatology, vol. 53, no. 2, 2014, pp. 538-549.
We Urge You To Call Us For Any Doubts & Clarifications That You May Have. We Are Eager to Talk To You
Call Us: +91 7406663589
We Urge You To Call Us For Any Doubts & Clarifications That You May Have. We Are Eager to Talk To You
Call Us: +91 7406663589
Brigade Deccan Heights, 42, 14th Floor, 5th Mile, Tumkur Rd, Yeshwanthpur Industrial Area, Phase 1, Yeswanthpur, Bengaluru, Karnataka 560022
Rated 4.7/5 with a total of 62 reviews
#1120, 11th Floor, Solitaire business Hub - Baner, Balewadi High Street, Baner, Pune-411045
Rated 4.7/5 with a total of 17 reviews
801, 8th Floor, LODHA Supremus, I-Think Techno Campus,Kanjurmarg EAST - MUMBAI, MH, India – 400042.
Rated 5/5 with a total of 51 reviews
501, 5th Floor, Connekt Coworking Space, Gala Argos, Netaji Rd, Ellisbridge, Ahmedabad, Gujarat 380006
Rated 4.1/5 with a total of 7 reviews
Best Engineering Aids & Consultancies Ltd. No 306, Karunaa Conclave, 3rd Floor, AD Block, Shanthi Colony, Anna Nagar, Chennai - 600040
Rated 4.6/5 with a total of 16 reviews
A-101, 1st Floor, The Hub Complex, opp. Shete Hospital, Mahatma Nagar, Parijat Nagar, Nashik, Maharashtra 422005.
Best Engineering Aids & Consultancies Ltd (BEACON) Wellwork Workspaces, L1 - 1017A,B, Lower Ground Floor,Vasavi MPM Grand, Ameerpet, Hyderabad, Telangana 500073
2nd floor, Mokha Tower, Plot No.169, Mankapur Ring Rd, Trimurti Nagar, Nagpur, Maharashtra 440022


 Location